This web is under construction, but you can check a few empirical results of the project BeeFun:
Empirical results: Part of the project implies collecting plant-pollinator networks along a land use change gradient. You can play with the network here (not embedded because WordPress do not support iframes).
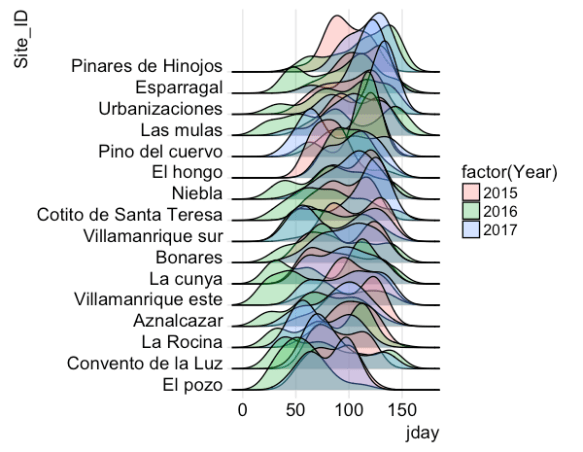
We are following this networks along the years, and you can see below pollinator phenology in 2016 was earlier (and longer!) in all study sites.
Synthesis results:
Unexpected outputs:
