Pollination effectiveness landscape

I want to show you a pollination landscape, but this is not a pollinator landscape with flowers and nesting sites, but a plot showing two components of pollination. Quantity and quality. A recent paper by Pedro Jordano (see here for other work on seed dispersal landscapes) inspired me to plot my data that way, which I think is just awesome. I am a little ashamed I can not fully follow the part of his code (but is great that people is sharing code!) dealing with plotting the z axis… but if you have a hammer, all your problems will look like nails. And I had used recently expand.grid( ) and loess( ), so I used those to do my z axis. I also think is nice that people has two options to plot the data. So here is the plot:

plot

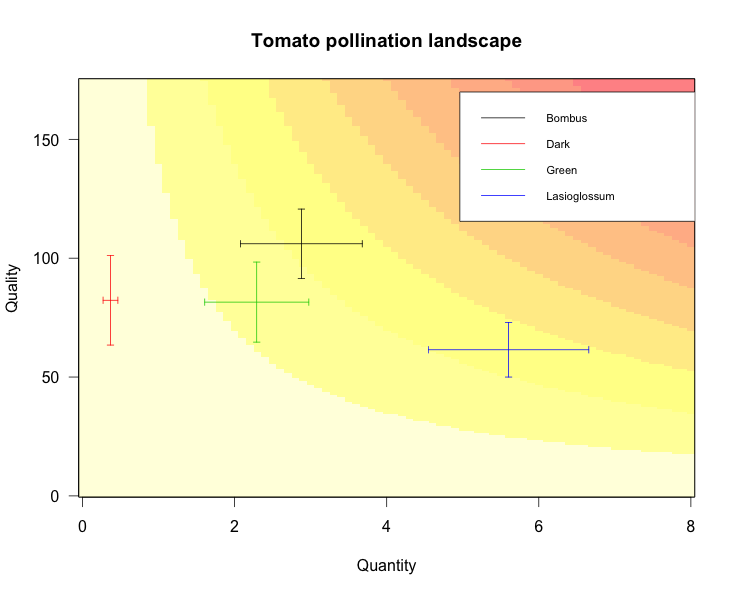
Here you just see that bumblebees and Lasioglossum provide similar total pollination levels (yellow), but through different mechanisms (quantity or quality).

Here you can find the code to reproduce the plot.

Biodiversity shared-blog

I am rather a chaotic blog reader. I scan some RSS feeds, check blog aggregators from time to time (R-bloggers and Ecobloggers) and rely on tweeter as a curating tool that brings me the best posts directly to my timeline. Today I discovered http://www.biodiverseperspectives.com/ and it’s clearly a must read.

Cool posts like this one a side, I think is a wonderful idea. Grad students (and faculty) around the globe can register and post about a common topic: Biodiversity (check out their diagram on the upper-right part of the homepage, which covers a lot of ground). Having a personal blog may be not for everyone (I’m still exploring it), so it’s great to have a platform to share something from time to time, and with a nice readership already built.

We know nothing

Today I read a paper about bee population dynamics published in Ecology (Franzen and Nilsson 2013). Given the current concern about bee declines (more on that in a few weeks) one can assume we (scientists) understand the basic dynamics of bee populations, or at least we have an idea of their life histories. Well, the paper monitored one metapopulation of one species during 9 years and found that fluctuations on the number of nests among years are huge (more than one order of magnitude). Why? We don’t know and It is not correlated with floral resources or climate. Some speculations include source-sink dynamics, a prolonged diapause or bet hedging strategies to avoid natural enemies. We know nothing. And you may ask, why is this published in Ecology? Well, because I think is a good paper that at least shows some data. That means that given the knowledge we currently have, this tiny bit of information advances our understanding.

Really basic research is not sexy but can we (and I am the first guilty) understand a pollinator crisis if we don’t know if it is predation or it is competition what is driving bee fitness. Or can we understand the actual structure of plant-pollinator networks, which are characterised by an incredible turn over among years, without knowing if bed hedging strategies are the norm or the exception (Danforth 1999). Can we assess the effect of landscape configuration on bee populations without the basic natural history information like eggs per female, or growth rates?

Image

Franzen M. & Nilsson S.G. (2013). High population variability and source-sink dynamics in a solitary bee species, Ecology, 130204095918002. DOI: