is_invasive( ) got a new best friend: is_native( )

A while ago I did a function to check if a species was among the worst invaders. I am really happy this function was used and ropensci put it in a package. However the function does not tell you if a species is exotic in a particular place, and this is what most people want to know. Scott Chamberlain found a couple of other resources to get invasive species lists and we where discussing where to find those reliable, complete “lists of exotic species per region”, but we where thinking the problem from the wrong approach.

Exotic species lists will be always incomplete and hard to maintain. For most research questions the reverse question is also suited. Instead of “is exotic?”, you can ask “is not native?” Lists of natives species are easier to get and stable through time. Moreover, It conveys the message that any non native species is potentially harmful, rather than restricting to “worst invaders” or “known exotic species”.

So here it is. Its implemented for animals and plants in the US (using ITIS database) and for Plants in Europe (Using Flora Europaea)*. You can use it with the following R code:

install.packages("devtools")
library(devtools)
install_github("ibartomeus/traits")
library("traits")

#make a species list
sp <- c("Lavandula stoechas", "Carpobrotus edulis", "Rhododendron ponticum", "Alkanna lutea", "Anchusa arvensis")

#ask in which countries the first species is native by querying in Flora Europaea
fe_native(sp[1])
?fe_native #to see the help page.

#use sapply for querying all species at once
sapply(sp, fe_native, simplify = FALSE)

#ask if the first species is native in a particular region
is_native(sp[1], where = "Islas_Baleares", region = "europe")
?is_native #to see the help page and country names used

#or all species at once
sapply(sp, is_native, where = "Continental US", region = "america")
sapply(sp, is_native, where = "Islas_Baleares", region = "europe")

#for america I am calling itis_native function from taxize package.

The function will be available from ropensci/traits soon, and probably Scott will make it faster and more usable. Let me know if it breaks with any species or if the help pages needs clarifications and I can try to fix it.

*If you know/have a list of all native species for your region of interest, we can add it.

Scrum-like lab meetings

UPDATE: @naupakaz shared a paper explaining a very similar idea via twitter.

Organising successful lab meetings is not an easy task, specially when your group may not have a critical mass of PhD’s and PostDocs. Main aims of the meetings for most labs I’ve been include 1) stay up-to-date on what people is doing, 2) Discuss relevant literature, 3) Give early feedback on peoples projects and 4) discuss techniques, methods or academic culture. And above all, the most important thing for me is that they has the potential to build team spirit.

Despite the above points are all well-aimed, and most times are more or less accomplished, I have also seen some lab meetings fail and people feeling that going is an obligation/waste of time rather than an opportunity. The main reason for that I think is that meetings tend to be no prepared in advance. This is usually associated to overly long meetings and people not being engaged with the topic.

This will be my approach starting next Monday. SCRUM-like stand up meetings every Monday  and Wednesday 9:30 am (sharp!) in my office. Maximum duration 15 minutes (strict!). During the meeting each person will answer this three questions.

  • What I did / learn last week.
  • What I plan to do this week.
  • Which help do I need to accomplish the plan.

In that moment there is no discussion around those questions. If anything needs to be discussed at length, we will schedule a specific meeting for that just with the interested actors. Moreover we will do this in English, not in Spanish, to force new PhD students to get into the habit to talk in english.

This structure has several advantages. Keeps everyone updated and fosters interaction among the different members of the group. Helps you think about what you accomplished /learnt, which should be a positive reinforcement. And finally helps you to plan ahead and be goal oriented. For me as a mentor, allows me to be on the loop on all projects in a fast way, and allows me to act as a facilitator, rather than as an old-school leader. SCRUM people do this everyday, but I think in my lab each people work in a quite different / independent project, so maybe two days a week its fine. However, my IT friends maintain that the way to go is a meeting every morning, so I’ll consider it.

Regarding the other aims of lab meetings, I’ll get advantage of others labs to gain critical mass. EBD runs a monthly Journal club we will attend to discuss papers. This will also make us read broader. We will also join Montse Vilà’s group for getting feedback on projects or discussing methods. This longer meetings will be scheduled when need and will have to requisites. One hour maximum duration and people has to come prepared in advance.

The post is getting lengthy, so I wont go into implementing formal retrospectives every time we publish a paper, but if you are interested in “Agile” development, follow the wikipedia links on SCRUM and Agile.

Why collecting Long Term Ecological Data is not cool enough for funding agencies?

Most of my papers include in one way or another a sentence apologising for not having long term data, and excusing myself for using either a snapshot of whatever happens in a given year, or using long term data that is limited in regards of its completeness or has sampling limitations. This is because most pressing questions in ecology require to consider time to fully understand how things work, but temporally replicated data is rare.

The solution? Let’s collect the appropriate data, then! Not that simple. Funding for long term ecological data is almost non existing in EU*. I guess they take too much time to build up, and do not produce high impact factor papers in the first year. However, most long term research is not expensive, and can be maintained with a small budget, but surprisingly nobody wants to fund it. And yes, I tried, and I got comments like “not novel enough”.

Why I am writing this now? The Doñana Biological Station has been doing some monitoring programs for the last ~10 years. I am not going to explain the details, because I’ll probably do it wrong, but the fact is that the long term monitoring funds externally granted for 2014 didn’t arrived and the monitoring of e.g. butterflies in the park where about to be suspended in 2015. It was only thanks to the direction of EBD, and individual researchers that we can finally maintain this going, and avoid losing the temporal series, at least,  in 2015. For example, the cost of maintaining the butterfly monitoring is under 1000 EUR, which I will cover this year from my personal grants**. I am not using this data right now and the data is publicly released, but I see the value of having it. With the several threats the park has right now, including climate and land use change, having a baseline data on how communities fluctuate is critical to understand how the ecosystem will respond.

I would like to do more long term ecological research in my lab. I calculated this research will cost less than ~4 000 EUR/year. Why the Spanish ministry is willing to give me a ~50 000 budget for a 3 years project, but not a 12 year project with the same budget? I know it’s a political constrain, but Science should be beyond politics.

*LTER sites in the US is not optimal, but works better than here.

** And I know other researchers are assuming costs of monitoring other organisms.

Postdoc position available with me in plant-pollintor networks

PDF version here.

We are currently seeking applicants for a 18 month Postdoc position at Estación Biológica de Doñana (EBD-CSIC) in Sevilla to conduct synthesis work on the effect of landscape structure and mass-flowering crops on pollinator function to native plants, and plant-pollinator networks across Europe.

The postdoc will contribute to the funded BIODIVERSA project (Enhancing biodiversity-based ecosystem services to crops through optimized densities of green infrastructure in agricultural landscapes (ECODEAL, http://www.cec.lu.se/research/ecodeal). 

Candidates should have an interest in pollination ecology, know how to handle large complex databases, and have strong writing and statistical skills (preferably in R).

If you are interested in this position, please, send your CV with a complete list of your publications and the contact details of two reference persons to nacho.bartomeus@gmail.com. Please, merge all documents into a single PDF file and include your name in the file name.

Salary: 35.040 € per yr. before taxes

Deadline for interested applicants: March 30th, 2015

Montserrat VilàNacho Bartomeus 

Getting the most of mix models with random slopes

I use mix models as a way to find general patterns integrating different levels of information (i.e. the random effects). Sometimes you only want to focus on the general effects, but others the variation among levels is also of interest. If this is the case, using a random slope model is pretty cool, but making sense of lmer output is not trivial. I provide here code to get the random slopes and CI’s of such models using the iris dataset in R (mainly, because I am sure I will need to check this entry in the future myself)

#This shows how to get the random slopes and CI's for each level in a hierarchical model

Is there a general relationship between petal and sepal width? and how it differs by species?

plot(iris$Sepal.Width ~ iris$Petal.Width, col = iris$Species, las =1
Uno
#Our model with random slope and intercept
library(lmer)
m2 <- lmer(data = iris, Sepal.Width ~ Petal.Width + (1 + Petal.Width|Species))
#extract fixed effects
a=fixef(m2)
#extract random effects
b=ranef(m2, condVar=TRUE)
# Extract the variances of the random effects
qq <- attr(b[[1]], "postVar")
e=(sqrt(qq)) 
e=e[2,2,] #here we want to access the Petal.Weigth, which is stored in column 2 in b[[1]], that's why I use the [,2,2]
#calculate CI's
liminf=(b[[1]][2]+a[2])-(e*2)
mean_=(b[[1]][2]+a[2])
limsup=(b[[1]][2]+a[2])+(e*2)
#Plot betas and its errors
dotchart(mean_$Petal.Width, labels = rownames(mean_), cex = 0.5,         xlim = c(0.4,1.4), xlab = "betas")
#add CI's...
for (i in 1:nrow(mean_)){
     lines(x = c(liminf[i,1], limsup[i,1]), y = c(i,i)) 
}
dos
#make final plot
plot(iris$Sepal.Width ~ iris$Petal.Width, col = iris$Species, las = 1)
#and plot each random slope
abline(a = b[[1]][1,1]+a[1], b= mean_$Petal.Width[1], col = "black")
abline(a = b[[1]][2,1]+a[1], b= mean_$Petal.Width[2], col = "red")
abline(a = b[[1]][3,1]+a[1], b= mean_$Petal.Width[3], col = "green")
#and general response
abline(a, lty = 2)
tres

The code is fast and dirty, I know I can be more consistent, and the plot can be nicer (clip the slopes, add SE’s), but will work to get the idea.

& thanks to Lucas Garibaldi for sharing much of this knowledge with me.

And the gist: https://gist.github.com/ibartomeus/f493bf142073c704391b

Can functional diversity indices predict ecosystem function?

That is exactly the question Vesna and I had after reading a few papers using FD indices as proxies of function. Other than a few papers on plants (mostly experimental and with biomass production as the function studied) we couldn’t find the answer. Then is when we started a side project to gather the data necessary to answer our question. The problem is that there are many FD indexes (see previous post here) and many functions to test. So after realising that this was not a side project anymore we gathered data on as many functions as we can find (a.k.a. calling past collaborators and assaulting ecologists for data in the darker corridors of the conferences we attended) and developed a serious analysis.

The answer? Well, I wouldn’t use FD metrics to predict a single function (i.e. pollination to a single plant species or predation of a single aphid species) because their predictive power are usually below 0.5. However, it worth nothing that non-experimental single functions are usually better described by a few traits than by classic taxonomic diversity indices. It seems it depends on the function studied, but functional identity and to some degree weighted functional diversity metrics can improve our mechanistic understanding of the BEF effects, and this is pretty cool.

Plus, this is the first paper with two lead authors and lots of GitHub commits I did, and it worked really well!

Enjoy the paper here.

Darwin’s autobiography

I read Darwin’s autobiography when I started my PhD and I liked it a lot. I found it by chance last week and I read its less than 100 pages again. It’s simply amazing to be able to read what Darwin thought about himself. I share a few thoughts here, but I recommend its reading insistently. First is cristal clear that part of the success of Darwin was a curiosity driven instinct. But it worths nothing to me that a will to put his name among top scientists also contributed a lot in his endeavour. Do not be ashamed to cultivate both things then! Another thing that I loved is how he puts data always in front and uses a strict scientific method. It’s also cool to se how geology is his main field during most of his life, and not biology. In fact, I think he approaches biodiversity as a geologist (more used to the idea of change) and this is key to think differently. Also note that investing at least 4 years in a given project was the norm. That gave him the chance to refine the theory and get the best of it. Luckily for him, not a publish or perish culture yet. Other passages about his life, how chance is involved in his Beagle enrolment or how he judge his wits are also cool to read.

Happy new year!

Preferring a preference index

First I like to use a quantitative framework (you can use ranks-based indices as in Williams et al 2011, which has nice properties too). The simplest quantitative index is the forage ratio:

#obs: observed frequency of visits to item 1
#exp: expected frequency of visits to item 1 (i.e. resource abundance/availability)
fr <- function(obs, exp){
    p_obs <- obs/sum(obs)
    p_exp <- exp/sum(exp)
    out <- p_obs/p_exp
    out
}

But it ranges from 0 to infinity, which makes it hard to interpret.

Second, the most used index is “Electivity” (Ivlev 1961), which is nice because is bounded between -1 and 1. “Jacobs” index is similar, but correcting for item depletion, which do not apply to my question, but see below for completness.

electicity <- function(obs, exp){
    p_obs <- obs/sum(obs)
    p_exp <- exp/sum(exp)
    out <- (p_obs-p_exp)/(p_obs+p_exp)
}

jacobs <- function(obs, exp){
    p_obs <- obs/sum(obs)
    p_exp <- exp/sum(exp)
    out <- (p_obs-p_exp)/(p_obs+p_exp-2*p_obs*p_exp)
    out
}

However, those indexes do not tell you if pollinators have general preferences over several items, and which of this items are preferred or not. To solve that we can use a simple chi test. Chi statistics can be used to assess if there is an overall preference. The Chi test Pearson residuals (obs-exp/√exp) estimate the magnitude of preference or avoidance for a given item based on deviation from expected values. Significance can be assessed by building Bonferroni confidence intervals (see Neu et al. 1974 and Beyers and Steinhorst 1984). That way you know which items are preferred or avoided.

chi_pref <- function(obs, exp, alpha = 0.05){
    chi <- chisq.test(obs, p = exp, rescale.p = TRUE)
    print(chi) #tells you if there is an overall preference. (sig = pref)
    res <- chi$residuals
    #res <- (obs-exp)/sqrt(exp) #hand calculation, same result.
    #calculate bonferoni Z-statistic for each plant.
    alpha <- alpha
    k <- length(obs)
    n <- sum(obs)
    p_obs <- obs/n
    ak <- alpha/(2*k)
    Zak <- abs(qnorm(ak))
    low_interval <- p_obs - (Zak*(sqrt(p_obs*(1-p_obs)/n)))
    upper_interval <- p_obs + (Zak*(sqrt(p_obs*(1-p_obs)/n)))
    p_exp <- exp/sum(exp)
    sig <- ifelse(p_exp >= low_interval & p_exp <= upper_interval, "ns", "sig")
    plot(c(0,k+1), c(min(low_interval),max(upper_interval)), type = "n", 
         ylab = "Preference", xlab = "items", las = 1)
    arrows(x0 = c(1:k), y0 = low_interval, x1 = c(1:k), y1 = upper_interval, code = 3
           ,angle = 90)
    points(p_exp, col = "red")
    out <- data.frame(chi_test_p = rep(chi$p.value, length(res)), 
                      chi_residuals = res, sig = sig)
    out
}

And we wrap up all indexes…

#wrap up for all indexes
preference <- function(obs, exp, alpha = 0.05){
    f <- fr(obs, exp)
    e <- electicity(obs, exp)
    #j <- jacobs(obs, exp)
    c <- chi_pref(obs, exp, alpha = alpha)
    out <- data.frame(exp = exp, obs = obs, fr = f, electicity = e, c)
    out
}

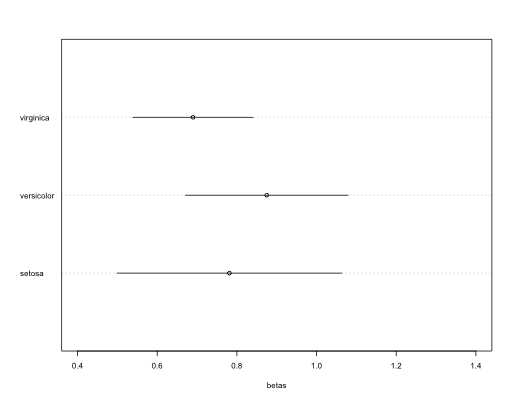
It works well for preferences among items with similar availability, and when all are used to some extent. The plot shows expected values in red, and the observed confidence interval in black. If is not overlapping the expected, indicates a significant preference.

x <- preference(obs = c(25, 22,30,40), exp = c(40,12,12,53))
1
##  Chi-squared test for given probabilities
## 
## data:  obs
## X-squared = 44.15, df = 3, p-value = 1.404e-09
##   exp obs     fr electicity chi_test_p chi_residuals sig
## 1  40  25 0.6250    -0.2308  1.404e-09        -2.372 sig
## 2  12  22 1.8333     0.2941  1.404e-09         2.887  ns
## 3  12  30 2.5000     0.4286  1.404e-09         5.196 sig
## 4  53  40 0.7547    -0.1398  1.404e-09        -1.786 sig

We can see that indices are correlated by simulating lots of random values.

x <- preference(obs = sample(c(0:100),100), exp = sample(c(0:100),100))
##  Chi-squared test for given probabilities
## 
## data:  obs
## X-squared = Inf, df = 99, p-value < 2.2e-16
pairs(x[,c(-5,-7)]) #more or less same patern, across indexes.

2

But the indexes do not behave well in two situations. First, when an item is not used, it is significanly un-preferred regardless of its abundance. I don’t like that, because a very rare plant is expected to get 0 visits from a biological point of view. This is an issue when building bonferroni intervals around 0, which are by definition 0, and any value different from 0 appears as significant.

x <- preference(obs = c(0,25,200), exp = c(0.00003,50,100))
3
##  Chi-squared test for given probabilities
## 
## data:  obs
## X-squared = 50, df = 2, p-value = 1.389e-11
##     exp obs     fr electicity chi_test_p chi_residuals sig
## 1 3e-05   0 0.0000    -1.0000  1.389e-11     -0.006708 sig
## 2 5e+01  25 0.3333    -0.5000  1.389e-11     -5.773502 sig
## 3 1e+02 200 1.3333     0.1429  1.389e-11      4.082486 sig

The second issue is that if you have noise due to sampling (as always), rare items are more likely to be wrongly assessed than common items.

#assume no preferences
x <- preference(obs = c(5,50,100), exp = c(5,50,100))
4
##  Chi-squared test for given probabilities
## 
## data:  obs
## X-squared = 0, df = 2, p-value = 1
##   exp obs fr electicity chi_test_p chi_residuals sig
## 1   5   5  1          0          1             0  ns
## 2  50  50  1          0          1             0  ns
## 3 100 100  1          0          1             0  ns
#now assume some sampling error of +-4 observations
x <- preference(obs = c(1,54,96), exp = c(5,50,100))
5
##  Chi-squared test for given probabilities
## 
## data:  obs
## X-squared = 3.671, df = 2, p-value = 0.1595
##   exp obs     fr electicity chi_test_p chi_residuals sig
## 1   5   1 0.2053  -0.659341     0.1595       -1.7539 sig
## 2  50  54 1.1086   0.051508     0.1595        0.7580  ns
## 3 100  96 0.9854  -0.007338     0.1595       -0.1438  ns

As a conclusion, If you have all items represented (not highly uneven distributions) or all used to some extent (not 0 visits) this is a great tool.

Happy to know better options in the comments, if available.

Gist with the code of this post here.

How to answer to reviewers

This is another of the aspects of doing science that nobody explicitly teach you. The basics are pretty simple to explain (just respond to everything and point by point). You start by mimicking what your mentor does, how other co-authors respond, and how other people respond to your reviewers.  But after seeing different co-authors at work, and specially now that I saw a lot of responses from different people as an editor, there are bad responses, good responses, and those so good, that make your paper fly to the publication stage. Why? The little differences.

1) Be concise (i.e. give a lot of information clearly and in a few words). You can spend some time in formalities and a “thank you” part and a “highlighting the strong points part” is important, but make your case quick and personal. Don’t thank reviewers for “enhancing the paper” because you have too. Thank them for pointing out A or B, which really made a difference. If comments were minor, its not necessary to make a big deal with empty words because you want to be concise. Being personal and not using pre-established “thanks you phrases” helps connecting with the reviewer and sets his/her mood for reading the rest. Also, always briefly highlight the positive things. Editors are busy people, if a reviewer are supportive or partially supportive, bring that up in the response to the editor to put him back in context.

2) Following with conciseness, show that you care about the science. If you did a good work, reviewers do not know your data/analysis as well as you do, so make them trust you by providing details on the decisions you made, and back up all your claims with data and references, not only in the Response to Reviewers, but also in the edited paper. This seems obvious, but I’ve seen several “we don’t agree with this change” without a proper justification.

4) Number your responses. that allow you to refer to previous responses, and avoids repetition. Nobody wants to hear the same justification twice. If your reviewer is not tidy (e.g. do not separate main concerns, from small comments), you should be. Your responses should always flow and for example, you can summary main changes first, and then refer to it when brought up by the reviewer in the middle of other in-line comments that deal with smaller wording issues.

5) Put the focus of the review on the ms, not on the R to R. That means that other than in particular cases you don’t quote the changes in the response, but refer to the lines where the changes are. BUT the real pro-tip is that you highlight the changes in the new ms. Track changes are burdensome and require software specific, but using a different color (I personally like using blue font because red is too contrasting) for the changed sentences in the new ms is a big help for reviewers. This allow both, a smooth read of the full paper, and makes it easier to find the new passages.

Any other tip you use?